Server Administrator – Monitor
See also: Server Administration Application Home Page
Server monitoring is implemented using javamelody.
Charts and Tables
Clicking on a chart displays the chart in more detail. The most useful charts are:
Used Memory:
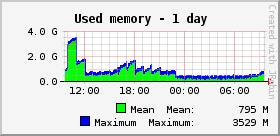
This chart shows used memory. The gradual increases followed by a sharp drop is normal behaviour for a Java system where the sharp drops are caused by garbage collection which frees memory which is no longer used. The memory baseline (the amount remaining after garbage collection) will be roughly 100Mb plus the size of the caches used by Verj.io: on a busy system these caches will gradually grow as the system is used and may eventually reach 300Mb or so. As a rough guideline the size of these caches should not exceed 25% of available memory.
A further chart Used non heap memory is available by clicking on Other charts – this shows the memory used for loaded Java classes – so-called “permgen” memory.
CPU
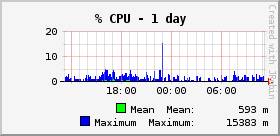
This chart shows the CPU used by the Verj.io server.
Http hits
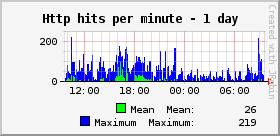
This chart shows the request rate and therefore represents the level of user activity.
Http sessions
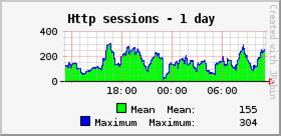
This chart shows the average number of connected users. Details of each session can be seen by clicking on the View http sessions link under System Information. Bear in mind that user sessions will remain active until they time out i.e. there has been no activity for the timeout interval set in web.xml. Clicking on a session id shows a list of session attributes together with the size of each attribute – this memory represents the user state that is retained between requests.
Http mean times
This chart shows the average response times for requests. Details for each request URL are shown by clicking the Details link to the right of the Statistics http table.
Data caches
Clicking the Details link displays a table showing the number of entries in the caches used by the Verj.io system. These caches are configured in Server Administration – General Properties.
Configuring the Monitor
The monitor is configured in the web.xml file in userdata/apps/<webappname>/webapp/WEB-INF under the comment <!-- START OF JAVAMELODY MONITOR CONFIGURATION -->. Details of all configuration options are provided in the Javamelody Users Guide. The following section describes the configuration options distributed with the Verj.io system that might need to be changed. Any changes to the web.xml file require a system restart.
Enabling/disabling monitoring
The following section can be uncommented to disable the monitor:
<!-- uncomment to disable the performance monitor
<init-param>
<param-name>disabled</param-name>
<param-value>true</param-value>
</init-param>
-->
Which URLs are monitored:
As distributed all images, javascript and css files are excluded. This is controlled by the following parameter in web.xml:
<init-param>
<param-name>url-exclude-pattern</param-name>
<param-value>/ebWebResource/.*|/doc/.*|/\$ws/.*|/designer|.*?\.gif|.*?\.jpg|.*?\.jpeg|.*?\.png|.*?\.css|.*?\.js</param-value>
</init-param>
This exclude pattern works together with the following filter pattern which includes all URLs:
<filter-mapping>
<filter-name>javamelody</filter-name>
<url-pattern>/*</url-pattern>
</filter-mapping>
Security
The monitor contains functionality to view system performance and also to perform some actions: these actions include starting garbage collection, invalidating sessions, clearing caches etc. While these actions are enabled, care should be taken to ensure that unauthorised users cannot gain access to the monitor.
As distributed the monitor can only be accessed by a client on the same system as the server. This is controlled by the following parameter which should be removed to grant full access:
<!-- limit access to localhost (access from other clients is not allowed) -->
<init-param>
<param-name>allowed-addr-pattern</param-name>
<param-value>127\.0\.0\.1</param-value>
</init-param>
The following section can be uncommented to add specific named users. Options also exist to use standard Tomcat authentication – see the Javamelody Users Guide.
<!-- uncomment to add authentication for named users
<init-param>
<param-name>authorized-users</param-name>
<param-value>user1:password1, user2:password2</param-value>
</init-param>
-->
The following section can be uncommented to disable all monitor actions. The monitor is then limited to just displaying information.
<!-- uncomment to disable monitor actions - garbage collection, invalidate sessions, clear cache files etc
<init-param>
<param-name>system-actions-enabled</param-name>
<param-value>false</param-value>
</init-param>
-->